What is it about?
The CITI-SENSE data web page provides a visualization of all data collected with the help of the CITI-SENSE platform.
The CITI-SENSE data web page is a web tool for viewing collected data on the CITI-SENSE platform. The user can choose to look at different data types and to combine these in a simple map.
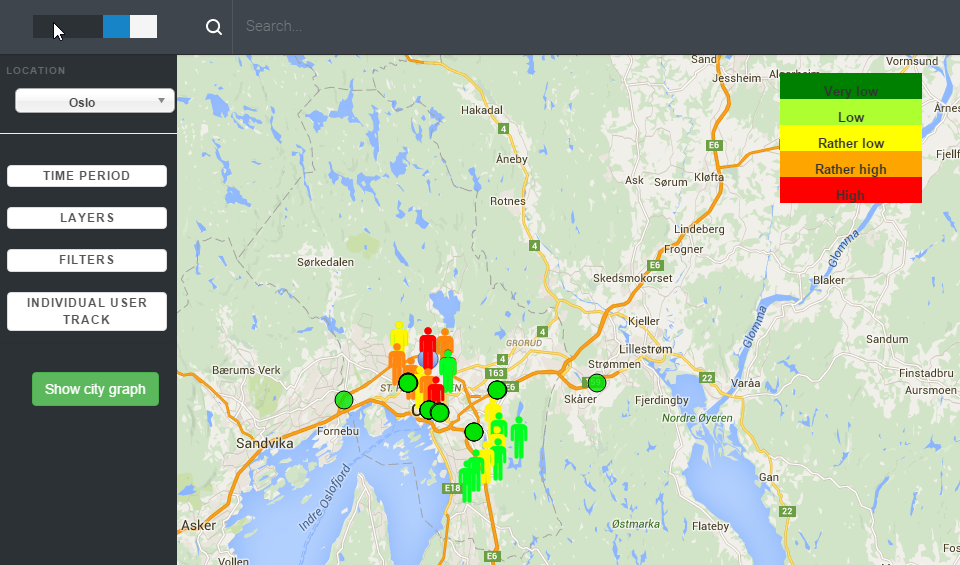
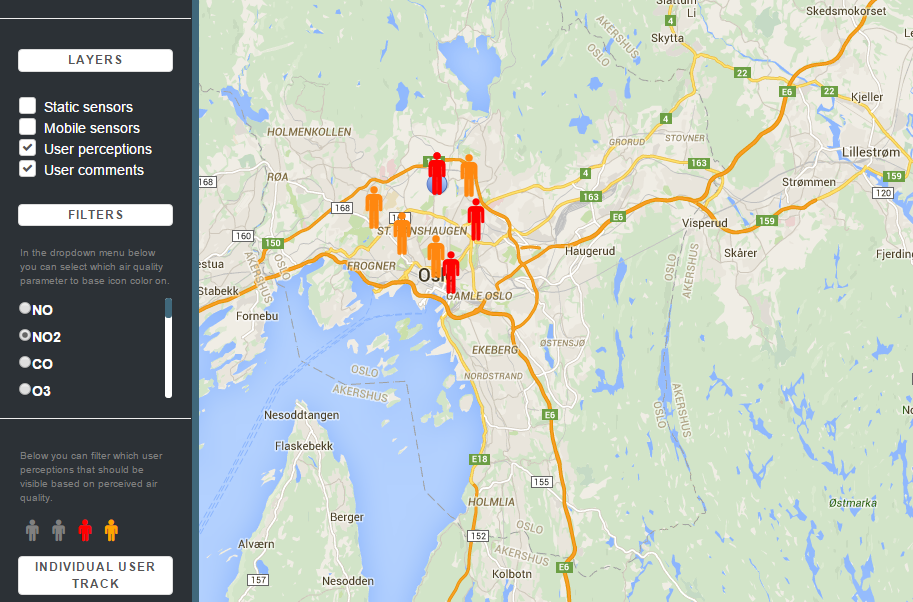
The user starts off by selecting a location from a predefined set of locations registered in our CITI-SENSE platform. When the location is chosen, the web page will upload as a default the last measured values on the following sensors:
- Static sensors
- Mobile sensors
- User Perceptions
- User Comments
How to use it?
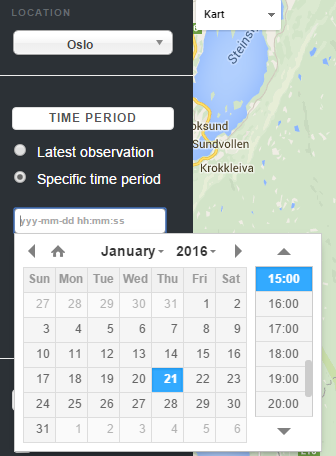
The user can choose to view data within a specific time period.
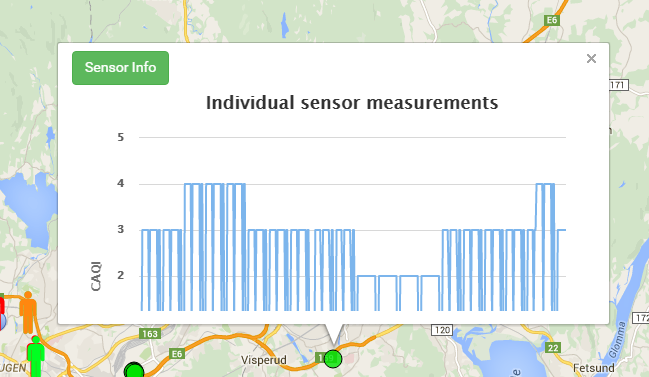
After clicking on a marker, the user will see more information about the sensor.
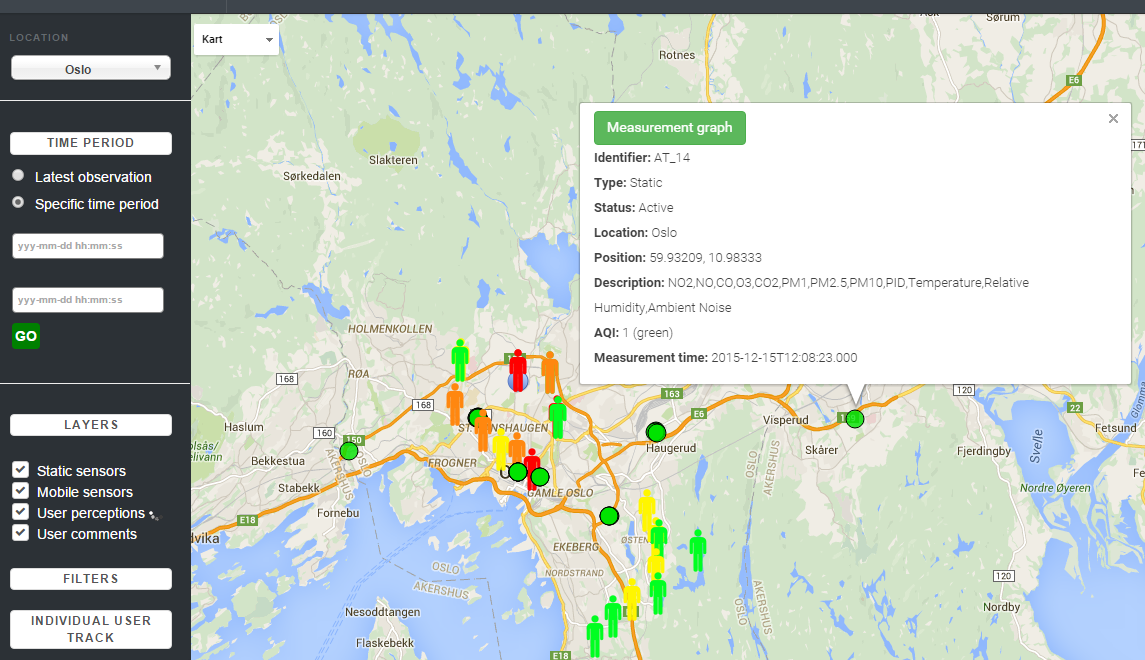
And the individual sensor`s measurements.
Several options are available for removing layers, or viewing individual air quality parameters and perception markers.
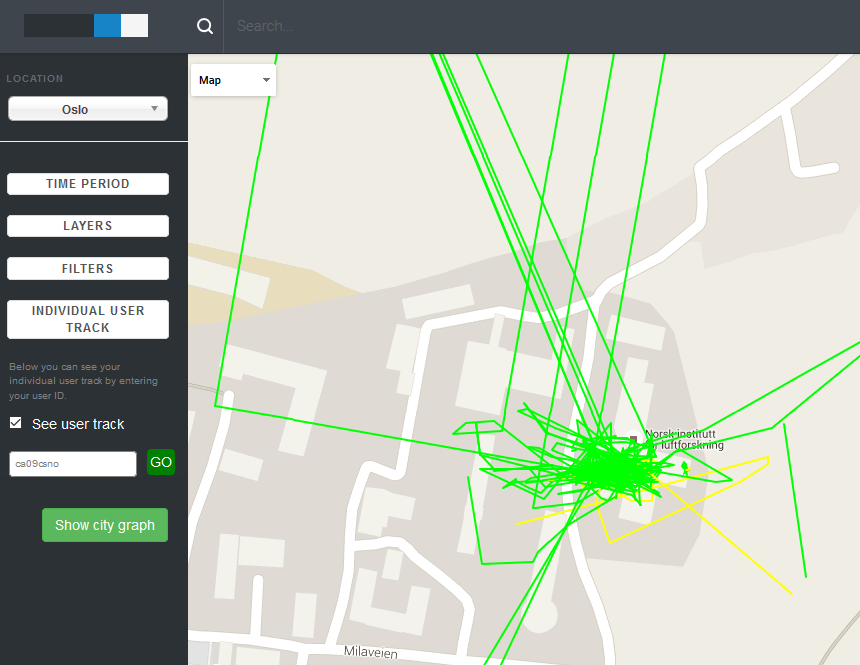
For mobile sensors, the user can fill in the unit’s user ID from the ExpoApp and track their measurements on the map.
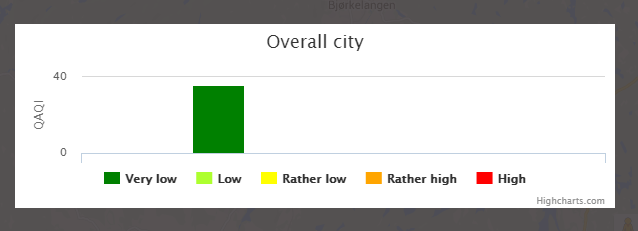
A summary graph is provided for each city, indicating the air quality as measured by the sensor units (please note that this may differ from the information provided by the public air quality information systems provided by the authorities, due to differences in monitoring methods, placements, local emissions, local meteorology, time scales and other important factors).